Logging at Scale - Part 1
Logging information from serving more than a billion requests per day
So I work for an Ad-Tech company, and in this industry we receive a huge volume and rate of requests. At our peak, we serve around 35,000 requests per second, which is actually a bigger number than you initially realize.
Over the past 2 years, our business has seen an exponential growth in the amount of requests we serve and the infrastructure we handle. When I joined 2 years back, we were serving like 400-500 qps and handled like 20 servers for different purposes. 2 years down the line, we have a spot fleet of logstash instances that do nothing but process logs and put it into our elastic cluster. Speaking of logstash cluster ….
So what exactly is the use case?
We have a simple set of requirements:
- Upon receiving a request, proxy it to one of our application servers based on some predetermined rules.
- Drop spammy traffic and rate-limit certain type of requests.
- Add/update some additional info in some selected requests.
- As a business requirement, all these parameters need to be dynamically configurable. So we use Kong, the popular API gateway as out reverse proxy. Kong also have some useful plugins that we use, and some custom plugins.
- Once the request makes it to the backend, the backend application(nodejs) makes multiple different redis lookups, applies some learning from a machine learning model, does some more calculation and then responds with either a valid response (200) or an empty response (204).
- The reverse-proxy then removes some of the headers which are only required for our internal logging and then sends the response back to the client.
The catch is, all this needs to be completed within 20 milliseconds. Now 20ms is still a decent amount of time to do everything if your servers are geographically close, but as the the traffic increases, abiding by this time restriction requires us to optimise and decrease load on our servers which can have a massive impact on performance. As the amount of requests and load on the system increases, the response time subsequently also starts to increase.
We also need some near real-time visualization for all our data, and for that we use elasticsearch and kibana. The access logs are parsed in realtime and pushed to our elasticsearch cluster.
The basic Idea
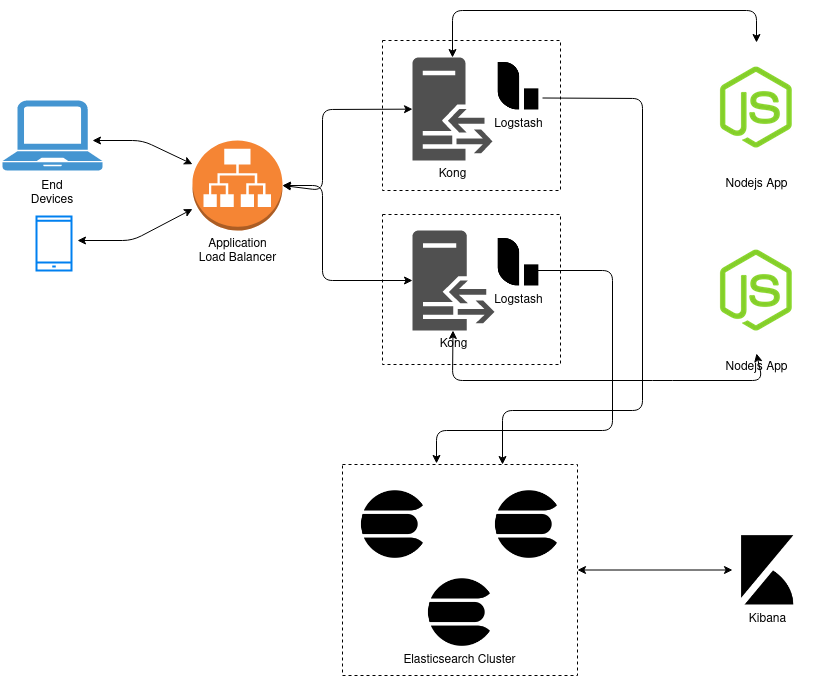
Well, basic idea was very simple. Have multiple upstream (nodejs) servers connected to multiple reverse-proxy (kong) servers. Leave the basic filtering, throttling and logging logic on the reverse-proxy servers, while the nodejs application only handles the important ad-serving logic. The reverse-proxy is also responsible for processing these raw access logs and send these to our elasticsearch cluster, so that we can visualize this data in realtime. This data is also the basis of many realtime alerts on our systems, so logging is a very important part. So initially we started with logstash also present on the reverse-proxy server which would read and parse the logs and send it to elasticsearch. Things were working great for a few weeks. Everything was hunky-dory, things looked fine and we were serving about 1.5-2k qps.
So what changed?
As traffic began to increase, logstash started consuming more CPU. After some time of sustained load, it turned out that the response times started increasing beyond our 20ms threshold. Running both our reverse-proxy and logstash services, which are both CPU intensive on the same machine was seriously impacting our overall performance. After some time of sustained load, logstash stopped working altogether. It was clear that another solution was needed. Initial thoughts were just using Kafka as an intermediate buffer, but due to the highly temporal nature of the traffic and the costs associated with maintaining a kafka cluster, we decided to explore other options.
The idea was to replace logstash with a much lighter log-shipper like rsyslog or filebeat and send it to servers running logstash for further processing, after which the logs ultimately get pushed to elasticsearch. Due to the temporal nature of the traffic, we decided to have an autoscaling group with spot instances (with a base on-demand instance of course) for running our logstash instances. Replacing logstash with filebeat led to our response time and load average decreasing again on our kong instances.
Theoretically this should have worked, but we ran into another issue while we were testing it. Everything was fine, until the traffic increased further and caused the logstash cluster to scale out. We had a load balancer attached to the target group which was attached to the auto scaling group, hoping that the requests would be load balanced b/w the logstash instances. But this did not happen.
What we noticed was that once filebeat made a connection with a logstash instance, all of the requests were getting sent to the same instance. So we ended up having all the requests being sent to a single logstash instance, while the other 2 were idle. After doing a little bit of research, it turned out that a lot of people were facing the same problem. Filebeat actually makes a persistent TCP connection with logstash and remains connected unless it is specifically broken. When filebeat reconnects again after the previous connection was broken, it might create another connection with a different instance depending on the instance ALB forwards it to, but it’s definitely not ideal.
The loadbalance parameter in the filebeat configuration worked as expected, but it needed the list of all instances while it started and the configuration needed to be updated and filbeat needed to be restarted everytime there was a change in the output servers list. So, that’s what we needed to do: Start filebeat on our reverse proxies with a default fallback value, and then update the configuration everytime there is a change in the list of in-service logstash instances. If there’s a change, update the list and restart filebeat.
# snippet to update filebeat output hosts; run as a cron
#!/bin/bash
dcid="<dcid-derived-from-logic>"
region="<region-derived-from-logic>"
as_logstash_instances=""
host_logstash_instances=""
as_logstash_instances=`curl -s "http://<server-hostname>/logstash-ip?dcid=${dcid}®ion=${region}"`
if [[ ! -f "/tmp/logstash-ip" ]]
then
echo $as_logstash_instances > /tmp/logstash-ip
else
logstash_out=`cat /tmp/logstash-ip`
host_logstash_instances=`echo -n $logstash_out`
fi
sed -i -e "s/hosts: .*/hosts: $as_logstash_instances/g" /etc/filebeat/filebeat.yml
if [[ "$as_logstash_instances" != "$host_logstash_instances" ]]
then
date=`date`
echo "making changes at $date"
echo "from: $host_logstash_instances to: $as_logstash_instances"
sed -i -e "s/hosts: .*/hosts: $as_logstash_instances/g" /etc/filebeat/filebeat. yml
echo $as_logstash_instances > /tmp/logstash-ip
service filebeat restart
fiHow we solved it
At such a high scale, we needed to actively look for any newly spawned logstash instances and start sending traffic to them as soon as possible so as to not overwhelm the existing instances. Similar thing needed to be done when the logstash cluster downscaled and the instance that was to be terminated needed to be removed from the filebeat output server list. So, we decided to have a cron running every 3 minutes just checking if there’s any changes in the logstash cluster. If it detects a change, it updates filebeat configuration and restarts the service.

A few simple AWS api calls would give us the IP addresses of all the in-service instances within the autoscaling group. So we created an intermediate server (a simple python HTTP server with boto3) that makes an api call to AWS for the given autoscaling group and gets us the list of IPs. Then we sort the list of IPs to make it easier to compare it to existing IPs. A specific route on this server returns a list of sorted IPs of running instances. In our kong instances, we have cronjob that runs every 3 minutes and makes a call on this route, gets the current list and compares it the existing list present in the filebeat configuration. If a change is found, the list is updated and filebeat is restarted.
# Using Flask to create a simple HTTP Server, route to return list of active logstash IPs

@app.route('/logstash-ip')
def getip_logstash():
    region_name = request.args['region']
    asg_client = boto3.client('autoscaling', aws_access_key_id="key", aws_secret_access_key="secret", region_name=region_name)
    ec2_client = boto3.client('ec2', aws_access_key_id="key",  aws_secret_access_key="secret", region_name=region_name)
    ec2 = boto3.resource('ec2', aws_access_key_id="key", aws_secret_access_key="secret", region_name=region_name)

    asg_name = ""

    if dc_id == "some-dc":
        asg_name = "some-dc-asg-name"
    elif dc_id == "some-other-dc":
        asg_name = "some-other-asg-name"
    # and so on....

    try:
        asg_response = asg_client.describe_auto_scaling_groups (AutoScalingGroupNames=[asg_name])

        # List to hold the instance-ids and the Private IP Address
        instance_ids, private_ip = [], []

        for i in asg_response['AutoScalingGroups']:
            for k in i['Instances']:
                instance_ids.append(k['InstanceId'])

        try:
            for instance_id in instance_ids:
                instance = ec2.Instance(instance_id)
                ip = instance.private_ip_address
                if ip:
                    private_ip.append(ip+":5044")
            private_ip.sort()

        except Exception as e:
            send_alert("AWS API call failed; Reason: \n" + str(e), critical=True)
            return "Failure"

        return str(private_ip)

    except Exception as e:
        send_alert("AWS API call failed; Reason: \n" + str(e), critical=True)
        return "Failure"
This might not be the best solution, and it definitely sounds like a bit over-engineered, but it works. Hopefully with more research, I’ll find a better, more efficient solution. But for now, we are able to get rid of our logging issues.
Share this post
Twitter
Facebook
Reddit
LinkedIn
Email